Choose + → from the main menu to launch
OpenOffice.org Calc.
Choose + → from the main menu to launch
OpenOffice.org Calc.
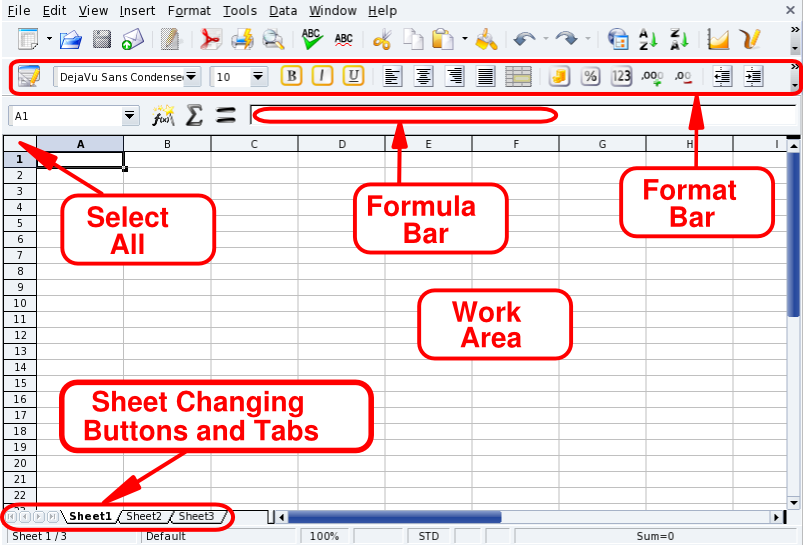
Format Bar. This is the standard format bar for all OpenOffice.org applications, you can use it to change fonts, colors, alignment, etc. of the application's data.
Formula Bar. Use it to enter, edit or delete formulas inside cells.
Work Area. This is where you enter the data in the spreadsheet: numbers, dates, formulas, images, etc.
Select All. Clicking on this
little area at the top left corner of the Work Area selects
all cells at once. It's useful when you need
to make changes which are “global” to the
spreadsheet. For example, changing all font sizes in the cells to
10pts (points).
Sheet Changing Buttons and Tabs. Spreadsheets usually contain more than one sheet. You can use these buttons to easily navigate through each of the spreadsheet's sheets. From left to right they are: Go to the first sheet, Go to the previous sheet, Go to the next sheet and Go to the last sheet. You may also use the tabs to switch between sheets.
To enter data into a cell, navigate to the cell and type the data in it, pressing the Enter key when you are finished.
Auto-completion simplifies data entry “guessing” the next cell's value using the current cell's value as a base. It works for any kind of data which can be associated to a simple series of integral numbers.
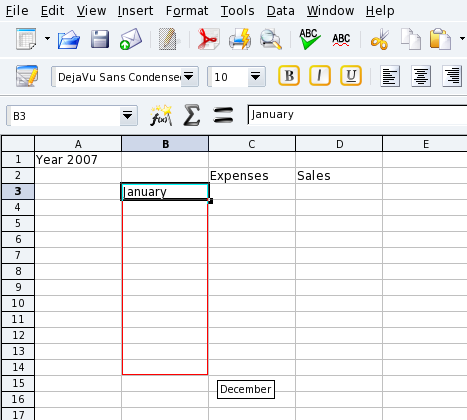
To use auto-completion, put your mouse over the base cell “handle” (the little square located at the bottom right of the cell border), click on it and drag the cell. The cell values are then shown in a tool-tip (see Figure 3.3, “Simplifying Data Entry Using Auto-Completion”). Release the mouse button to complete the cells once the desired final value is shown.
Cell data can also be sorted according to different criteria. Select the cells you want to sort and then open the sort options dialog choosing → from the menu. Specify the sort criteria, order and additional options and click on to sort the cells.
![[Tip]](images/tip.png)
Formulas can be used to
“automate” the spreadsheet. For example, you can run
complex simulations. Within cells, formulas are defined by
preceding all cell data with the =
sign. Anything else is treated as “static”
data.
Operations are
expressed using conventional algebraic notation. For example,
=3*A25+4*(A20+C34/B34) divides the value in
cell C34 by the value in cell
B34, adds the value in A20
to the result, multiplies that by 4 and adds it
to 3 times the value of cell
A25. Therefore, rather complex expressions can
be made using simpler ones as a base.
OpenOffice.org Calc gives you many pre-defined functions which you can use in your formulas. You can explore them by choosing the → menu.
 You can also click on the function wizard button for
assistance with formula entry.
You can also click on the function wizard button for
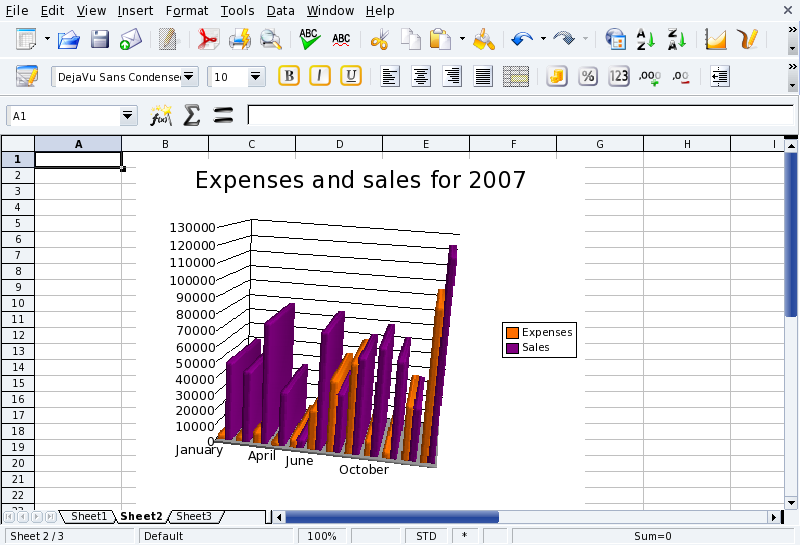
assistance with formula entry.When a spreadsheet contains too much information, it becomes difficult to understand how pieces of data relate to one another: too many numbers and too little meaning. The best way to represent this kind of data is through a chart.
As in all data-analysis functions, you must select the region you intend to show in the chart. So, select a range of cells and then choose → from the menu to bring up the chart assistant.
Make your selections for the chart type, variant, title, axis titles, etc., and then click to create and insert the chart in the spreadsheet (see Figure 3.4, “A 3D Chart Inside the Spreadsheet”).